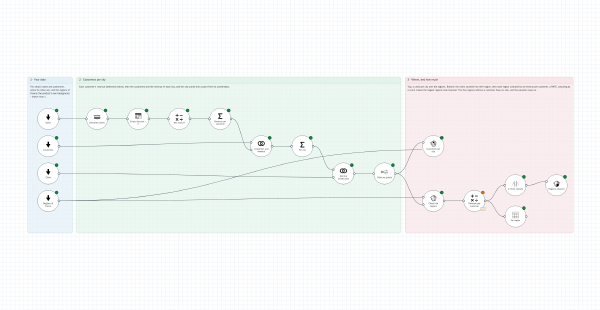
The shop’s customers counted per city and drawn where the cities are, then counted into the regions of France, each coloured by its revenue per customer. Needs the geo module. On the synthetic shop (180 customers in twelve cities) and the product’s map of the French regions.
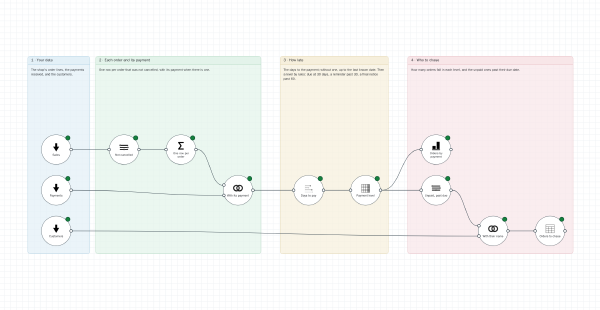
The days from each order to its payment, an unpaid one counted up to the last known date; a level by rules, from paid on time to final notice; and the orders to chase. On a synthetic sales dataset: one invented shop, 2024-2025.
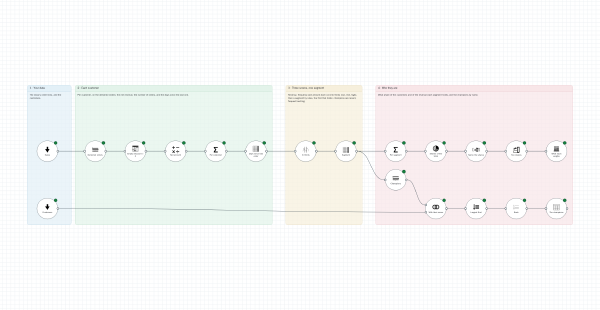
How recently, how often and how much each customer buys, cut into thirds; a segment by rules, from champions to lost; what each segment weighs in customers and in revenue; and the champions by name. On a synthetic sales dataset: one invented shop, 2024-2025.
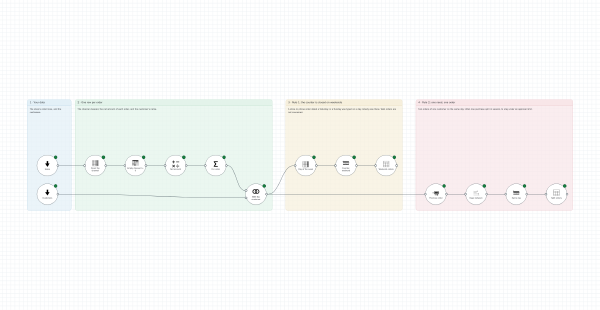
Two house rules checked on every order, a zone each: no store or phone order on a weekend, when the counter is closed; and no two orders of one customer on the same day. On a synthetic sales dataset: one invented shop, 2024-2025.
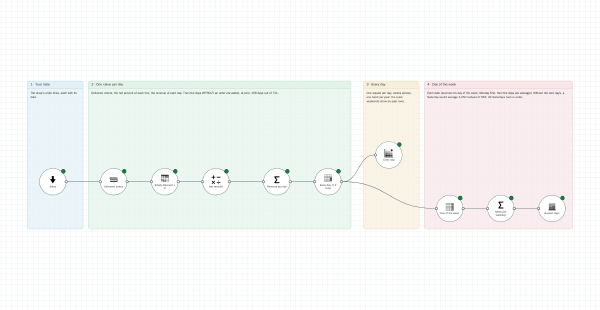
Every day’s revenue on a calendar, then the mean revenue of each day of the week. A workshop on dates: a day without an order is a day at zero, not a missing day. On a synthetic sales dataset: one invented shop, 2024-2025.
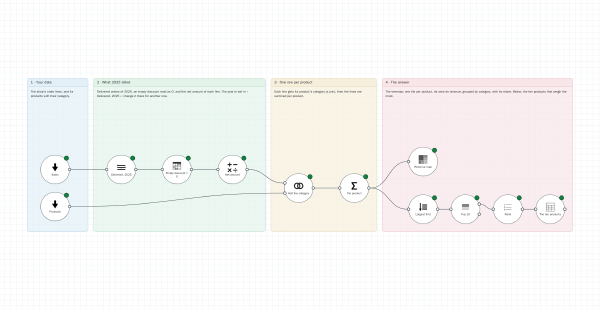
The net revenue of 2025 by category and product: a treemap shows each one’s weight and share at a glance, and the ten products that weigh the most are listed. On a synthetic sales dataset: one invented shop, 2024-2025.
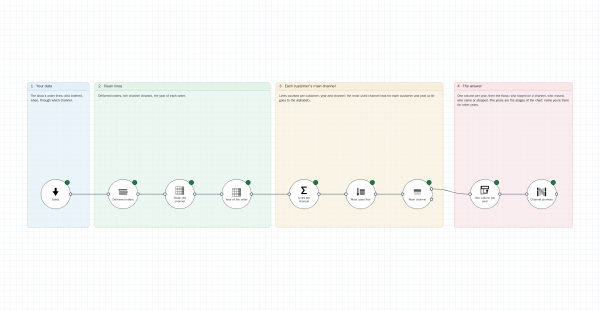
Each customer’s main channel in 2024, then in 2025, and the flows between the two: who stayed, who moved to another channel, who came, who stopped. On a synthetic sales dataset: one invented shop, 2024-2025.
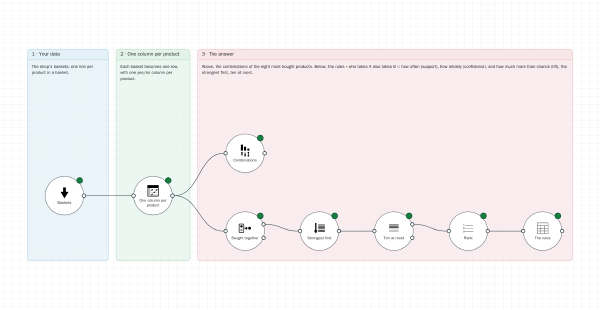
The baskets turned into one column per product: the combinations of the most bought products, and the strongest rules « who takes A also takes B ». Needs the statistics module. On a synthetic sales dataset: one invented shop, 2024-2025.
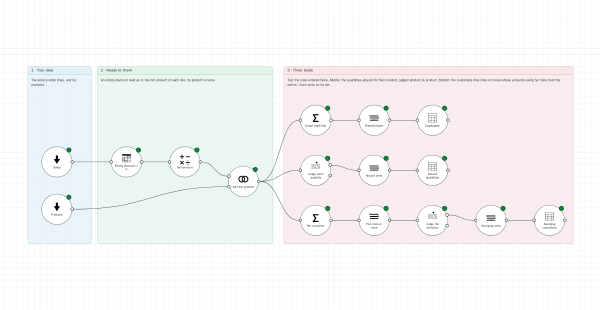
Three leads side by side: the lines entered twice, the quantities absurd for their product, and the customers whose amounts swing far more than the others’. Each ends on the list of what to look at. On a synthetic sales dataset: one invented shop, 2024-2025.
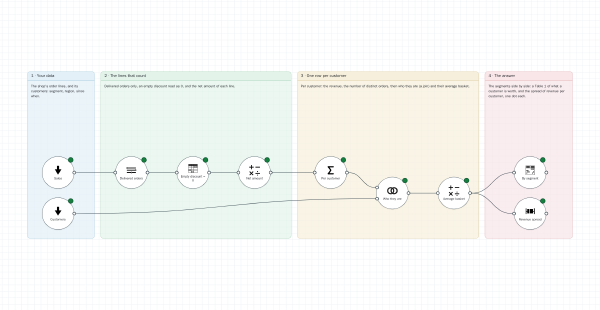
From order lines to one row per customer: orders, revenue, average basket. Then the segments compared, in a Table 1 and one dot per customer. On a synthetic sales dataset: one invented shop, 2024-2025.