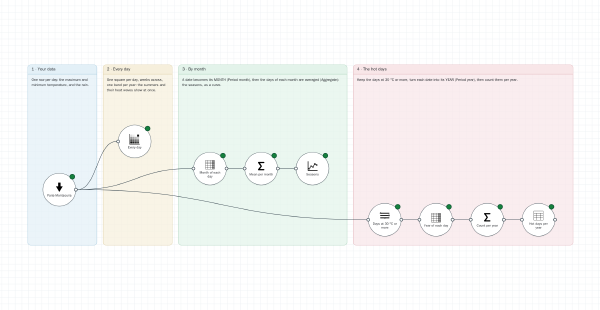
Four years of daily temperatures: every day on a calendar, the seasons month by month, then the hot days counted per year. A workshop on dates: turn a day into its month or its year, then aggregate. Data: Météo-France, daily climatological data, station Paris-Montsouris, 2022 to 2025 (Licence Ouverte 2.0).
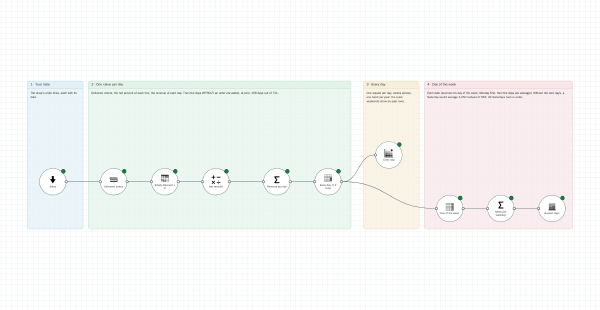
Every day’s revenue on a calendar, then the mean revenue of each day of the week. A workshop on dates: a day without an order is a day at zero, not a missing day. On a synthetic sales dataset: one invented shop, 2024-2025.
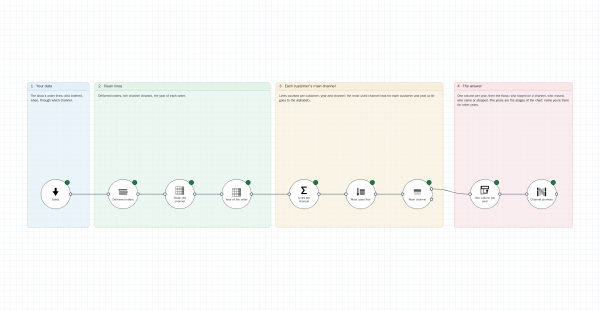
Each customer’s main channel in 2024, then in 2025, and the flows between the two: who stayed, who moved to another channel, who came, who stopped. On a synthetic sales dataset: one invented shop, 2024-2025.
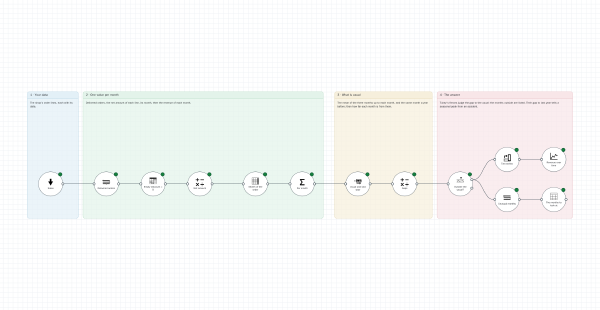
The revenue of each month against what is usual for it: the three months before, and the same month last year. The months that stand out are listed. On a synthetic sales dataset: one invented shop, 2024-2025.
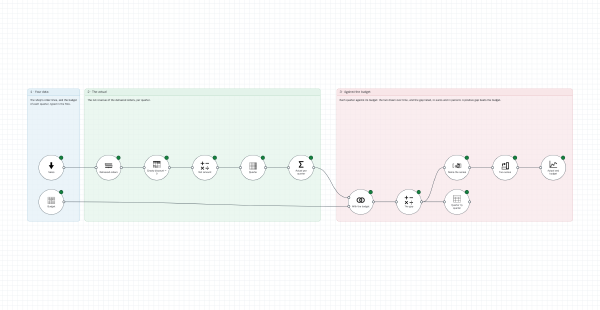
The net revenue of each quarter against a budget typed in the flow: the two drawn over time, and the gap of each quarter, in euros and in percent. On a synthetic sales dataset: one invented shop, 2024-2025.